Stacked Step Plot
Published:
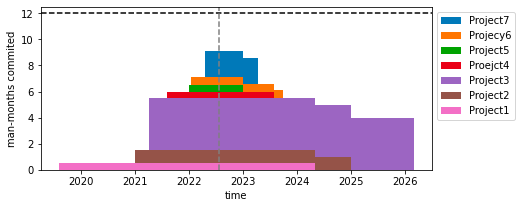
Matplotlib provides a stackplot, which stacks area, and a step plot, which provides steps, but there is no stacked step plot. This is useful when you have some accumulating resource that have different types that begin and end all at once. I personally had a need for this when I wanted to visualize my man-month commitment to my company’s funded projects over the next 7 years.
from itertools import chain

import numpy as np
import matplotlib.pyplot as plt

def plot_stacked_step(x, y, names, ax=None, sort=True):
    x_in = x
    y_in = y

    if sort:
        idx = np.argsort([x[0] for x in x_in])
        x_in = np.asarray(x_in)[idx]
        y_in = np.asarray(y_in)[idx]

    if ax is None:
        fig, ax = plt.subplots(figsize=(7, 3))

    all_x = sorted(set(chain(*x_in)))

    all_adj_y = []
    for xs, ys in zip(x_in, y_in):
        new_y = 0
        iy = 0

        adj_y = []
        for x in all_x:
            if x in xs:
                new_y = ys[iy] if iy < len(ys) else 0
                adj_y.append(new_y)
                iy += 1
            else:
                adj_y.append(new_y)

        all_adj_y.append(adj_y)

    stacked = np.cumsum(all_adj_y, axis=0)

    for name, i_stacked in list(zip(names, stacked))[::-1]:
        ax.fill(
            np.repeat(all_x, 2),
            np.hstack((0, np.repeat(i_stacked, 2)))[:-1],
            label=name,
        )

    return ax
Example usage (fake data)
from datetime import datetime

data = [
    {
        "name": "Project1",
        "start-stop": [datetime(2021,4,1), datetime(2026, 2, 28)],
        "man-months": 4,
    },
    {
        "name": "Project2",
        "start-stop": [datetime(2022, 1, 1), datetime(2022,12,31)],
        "man-months": 0.5,
    },
    {
        "name": "Project3",
        "start-stop": [datetime(2019, 8, 1), datetime(2024, 4, 30)],
        "man-months": 0.5,
    },
    {
        "name": "Proejct4",
        "start-stop": [datetime(2022, 4, 15), datetime(2023, 4, 14)],
        "man-months": 2.,
    },
    {
        "name": "Project5",
        "start-stop": [datetime(2021, 1, 1), datetime(2024, 12, 31)],
        "man-months": 1,
    },
    {
        "name": "Projecy6",
        "start-stop": [datetime(2021, 8, 1), datetime(2023, 7, 31)],
        "man-months": 0.5
    },
    {
        "name": "Project7",
        "start-stop": [datetime(2022, 1, 10), datetime(2023, 9, 30)],
        "man-months": 0.58,
    },
]

ax = plot_stacked_step(
    [x["start-stop"] for x in data],
    [[x["man-months"]] for x in data],
    [x["name"] for x in data],
)

ax.set_xlabel("time")
ax.set_ylabel("man-months commited")
ax.legend(bbox_to_anchor=(1, 1))
ax.axhline(12, ls='--', color='k')
ax.axvline(datetime.now(), ls='--', color=[.5, .5, .5])
ax.set_ylim((0, 12.5))