Grouped Bar Plot
Published:
I often have a need to plot a grouped bar plot. Matplotlib provides this example, which is helpful, but not quite generalizable enough for my needs, as it only shows how to group 2 categories together. Here is a generalization of that tutorial that was very helpful for me and I hope is helpful for others as well.
import matplotlib.pyplot as plt
import numpy as np

from typing import List, Optional


def grouped_barplot(
    data,
    clabels: List[str],
    xlabels: List[str],
    gap: float = 0.3,
    show_legend: bool = True,
    show_bar_labels: bool = True,
    ax: Optional[plt.Axes] = None,
):
    """

    Parameters
    ----------
    data: array-like
        size=(len(clabels), len(xlabels))
    clabels list(str):
    xlabels: list(str)
    gap: float
        Gap between categories
    show_legend: bool
        Show legend. Default = True
    show_bar_labels: bool
        Show data values above each bar. Default = True
    ax: plt.Axes
        If not provided, a new figure will be created.

    Returns
    -------
    ax, all_rects

    """


    if ax is None:
        _, ax = plt.subplots()

    x = np.arange(len(xlabels))  # the label locations
    width = (1 - gap) / len(clabels)  # the width of the bars

    all_rects = []
    for i, (cdata, clabel) in enumerate(zip(data, clabels)):
        rects = ax.bar(x - .5 + gap / 2 + i * width, cdata, width, label=clabel)
        if show_bar_labels:
            ax.bar_label(rects, padding=3)
        all_rects.append(rects)

    # Add some text for labels, title and custom x-axis tick labels, etc.
    ax.set_xticks(x, xlabels)
    if show_legend:
        ax.legend()

    return ax, all_rects
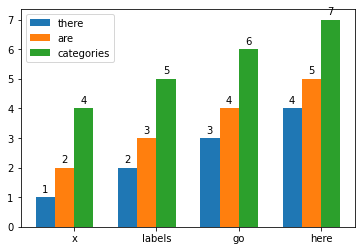
Example usage:
grouped_barplot(
    data=[[1,2,3,4], [2,3,4,5], [4,5,6,7]],
    clabels=["there", "are", "categories"],
    xlabels=["x", "labels", "go", "here"],
)